Natural-language queries
Type a business question and receive a chart and ranked answer — no SQL, no pivot tables, no waiting for a data team to run the query.

Analytics
Canberrahub's analytics module translates raw business data into clear cost, revenue and efficiency signals — so you can act on insight rather than instinct.
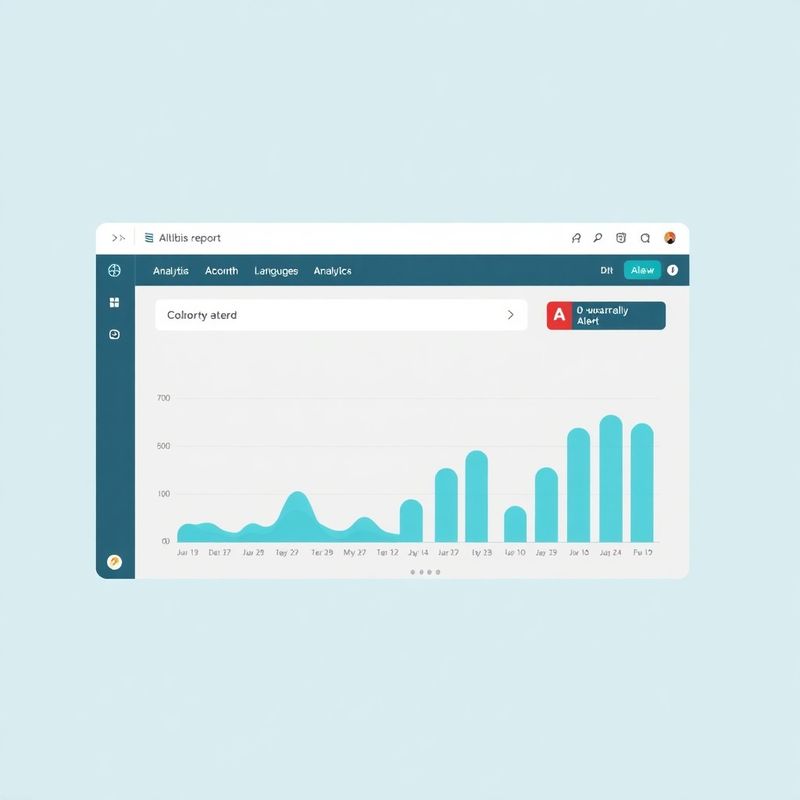
Gut feel has its place, but when a board asks why margin shrank last quarter or a sales director wants to know which campaign converted best, you need numbers that stand up to scrutiny. Canberrahub's analytics module is built around that moment. It connects to every data source in your stack, runs cohort analysis, attribution modelling and trend detection automatically, and surfaces results in plain-language summaries alongside the underlying charts. There's no need to train a data analyst or wait for an agency to build a custom report — the answers arrive in the platform within minutes of asking.
The analytics engine runs on a managed columnar warehouse — you never provision storage or tune query performance. Natural-language search lets any team member type a question like 'which product line had the highest return rate in Q2' and receive a ranked answer with a supporting chart. Automated anomaly detection flags unusual spikes or drops and sends an alert before they become surprises in a board meeting. Every report can be exported as a branded PDF or live web link, ready to share with stakeholders inside or outside your business. For teams that want to go deeper, raw data exports and API access are available on Professional and Enterprise plans.
Type a business question and receive a chart and ranked answer — no SQL, no pivot tables, no waiting for a data team to run the query.
The platform watches your key metrics continuously and alerts you the moment a figure moves outside its normal range — before a problem becomes a crisis.
Understand which acquisition channels produce the most valuable customers and how behaviour changes over time — standard cohort and multi-touch attribution reports included.
Export any report as a branded PDF or generate a live, password-protected web link your board or investors can access without a Canberrahub account.
“The natural-language query feature sounds like a gimmick until you use it. I asked 'which client segment had the lowest renewal rate last financial year' and had the answer in 12 seconds. That insight directly informed our retention programme for this year.”
Marcus Webb, GM Strategy, Stonebridge Advisory
No. The natural-language search and pre-built report templates are designed for business users, not data engineers. If you can write a sentence, you can query your data.
Most connected data sources refresh every 60 seconds. Batch sources like accounting systems typically sync every 15 minutes. You can always trigger a manual sync if you need the very latest figures before a meeting.
Yes. Every report can be exported as a branded PDF or as a live web link. The web link can be password-protected and set to expire after a chosen date — ideal for board packs or investor updates.
Raw exports and a read-only API are available on Professional and Enterprise plans. This lets your existing BI tools, data warehouses or custom dashboards query Canberrahub data directly.
Start a free trial and run your first natural-language analytics query within minutes of connecting your data sources.
Start free trial