Live data refresh
Metrics update every 60 seconds from connected sources, so you're never making decisions on yesterday's numbers.

Dashboard
Canberrahub's ROI Dashboard replaces vanity metrics with the figures your leadership team genuinely needs to make faster, better decisions.
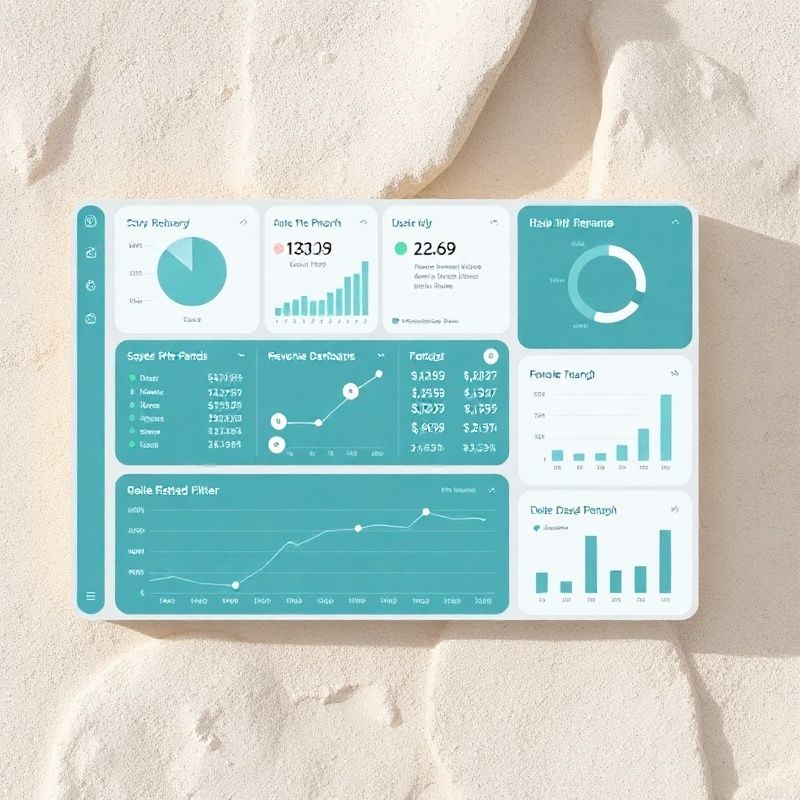
Most reporting setups are built backward — data engineers spend hours pulling figures that are already stale by the time they reach a decision-maker. Canberrahub's dashboard flips that model. It pulls live data from every connected source and surfaces the KPIs your team has agreed actually move the business. You configure the metrics once; the platform keeps them current. The teal-modern interface is designed for clarity at a glance, so whether you're checking in on a laptop in a Newcastle office or on a tablet before a client meeting in Sydney, the picture is the same: clean, current and actionable.
Under the hood, Canberrahub's Dashboard uses a columnar query engine that handles up to 50 million rows without a loading spinner. Drag-and-drop widgets cover revenue trend lines, funnel conversion rates, team capacity utilisation, and custom formula fields. Role-based permissions mean your finance team sees margin data while your sales team sees pipeline velocity — same dashboard, different lenses. Scheduled email digests can be sent daily, weekly or at any custom cadence, so insight reaches the inbox of anyone who doesn't log in every day. Setup takes roughly 45 minutes from account creation to a live, branded dashboard your whole team can navigate without training.
Metrics update every 60 seconds from connected sources, so you're never making decisions on yesterday's numbers.
Segment visibility by department or seniority. Finance, operations and sales each see exactly the data relevant to their work.
Automated email summaries land in inboxes at your chosen cadence — daily standups, weekly reviews, monthly board packs.
Define your own calculated metrics — blended CAC, net revenue retention, ops cost per transaction — without writing a single line of SQL.
“Before Canberrahub, our Monday morning report took three hours to compile. Now it's waiting in my inbox at 7 am, fully current. The dashboard paid for the entire annual plan in the first month on staff time alone.”
Daniel Forsyth, CFO, Meridian Build Group
Connect your data sources, configure your KPIs and share your first live dashboard — all within a single onboarding session.
Start free trial